
Scroll down to
discover more
Beyond the Metrics
Surfacing the Human Story in Security Training

Beyond the Metrics
Surfacing the Human Story in Security Training
Scroll down to
discover more
- 10 min → 10 sec
- to identify compromised users
- 5 tabs → 2 views
- for critical admin workflows
- 50+ companies
- managed per admin
More than a designer
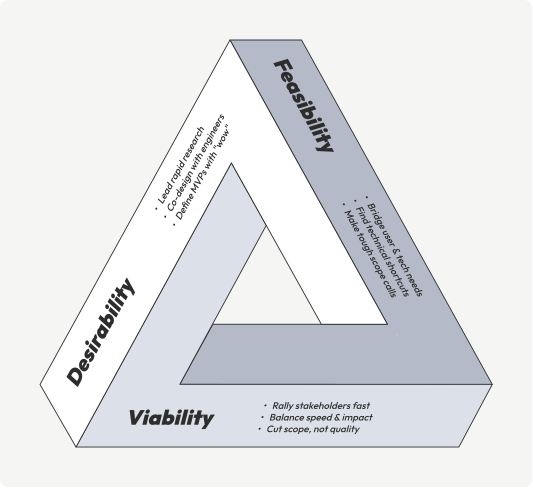
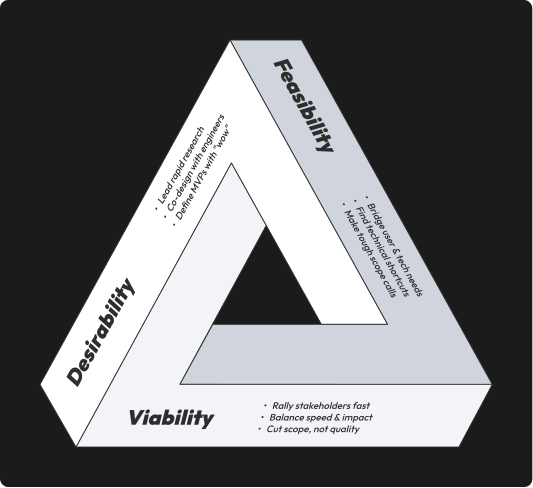
At Huntress, our small team demands versatility, so while research and interaction design is my specialty, I've expanded into a hybrid product design and product management role that spans multiple disciplines.
The work displayed in this case study captures my user research, how I connect my designs with business metrics that show our leadership the impact design has, and of course, I highlight my work as a designer focused on the never-ending search to refine my craft.
More than a designer
At Huntress, our small team demands versatility, so while research and interaction design is my specialty, I've expanded into a hybrid product design and product management role that spans multiple disciplines.
The work displayed in this case study captures my user research, how I connect my designs with business metrics that show our leadership the impact design has, and of course, I highlight my work as a designer focused on the never-ending search to refine my craft.
Ship now, ship wow
Our 10-person cross-functional team embodies our 'ship now, ship wow' principle, rapidly delivering exceptional value without getting caught in endless iteration cycles. Rather than operating in silos, we blend product design and research, engineering, security expertise, and product ownership into a unified force focused on continuous delivery.
Each sprint, I drive our 10-person team to prioritize and ship meaningful UX improvements to customers, owning the outcomes while maintaining the high quality bar that turns quick releases into wow moments. This approach means I partner directly with our principal engineers and security experts, moving fluidly from user research, to design, to implementation, setting the vision, facilitating key decisions, and ensuring we push code that matters, today, not someday.
Ship now, ship wow
Our 10-person cross-functional team embodies our 'ship now, ship wow' principle, rapidly delivering exceptional value without getting caught in endless iteration cycles. Rather than operating in silos, we blend product design and research, engineering, security expertise, and product ownership into a unified force focused on continuous delivery.
Each sprint, I drive our 10-person team to prioritize and ship meaningful UX improvements to customers, owning the outcomes while maintaining the high quality bar that turns quick releases into wow moments. This approach means I partner directly with our principal engineers and security experts, moving fluidly from user research, to design, to implementation, setting the vision, facilitating key decisions, and ensuring we push code that matters, today, not someday.
Before Design
Before
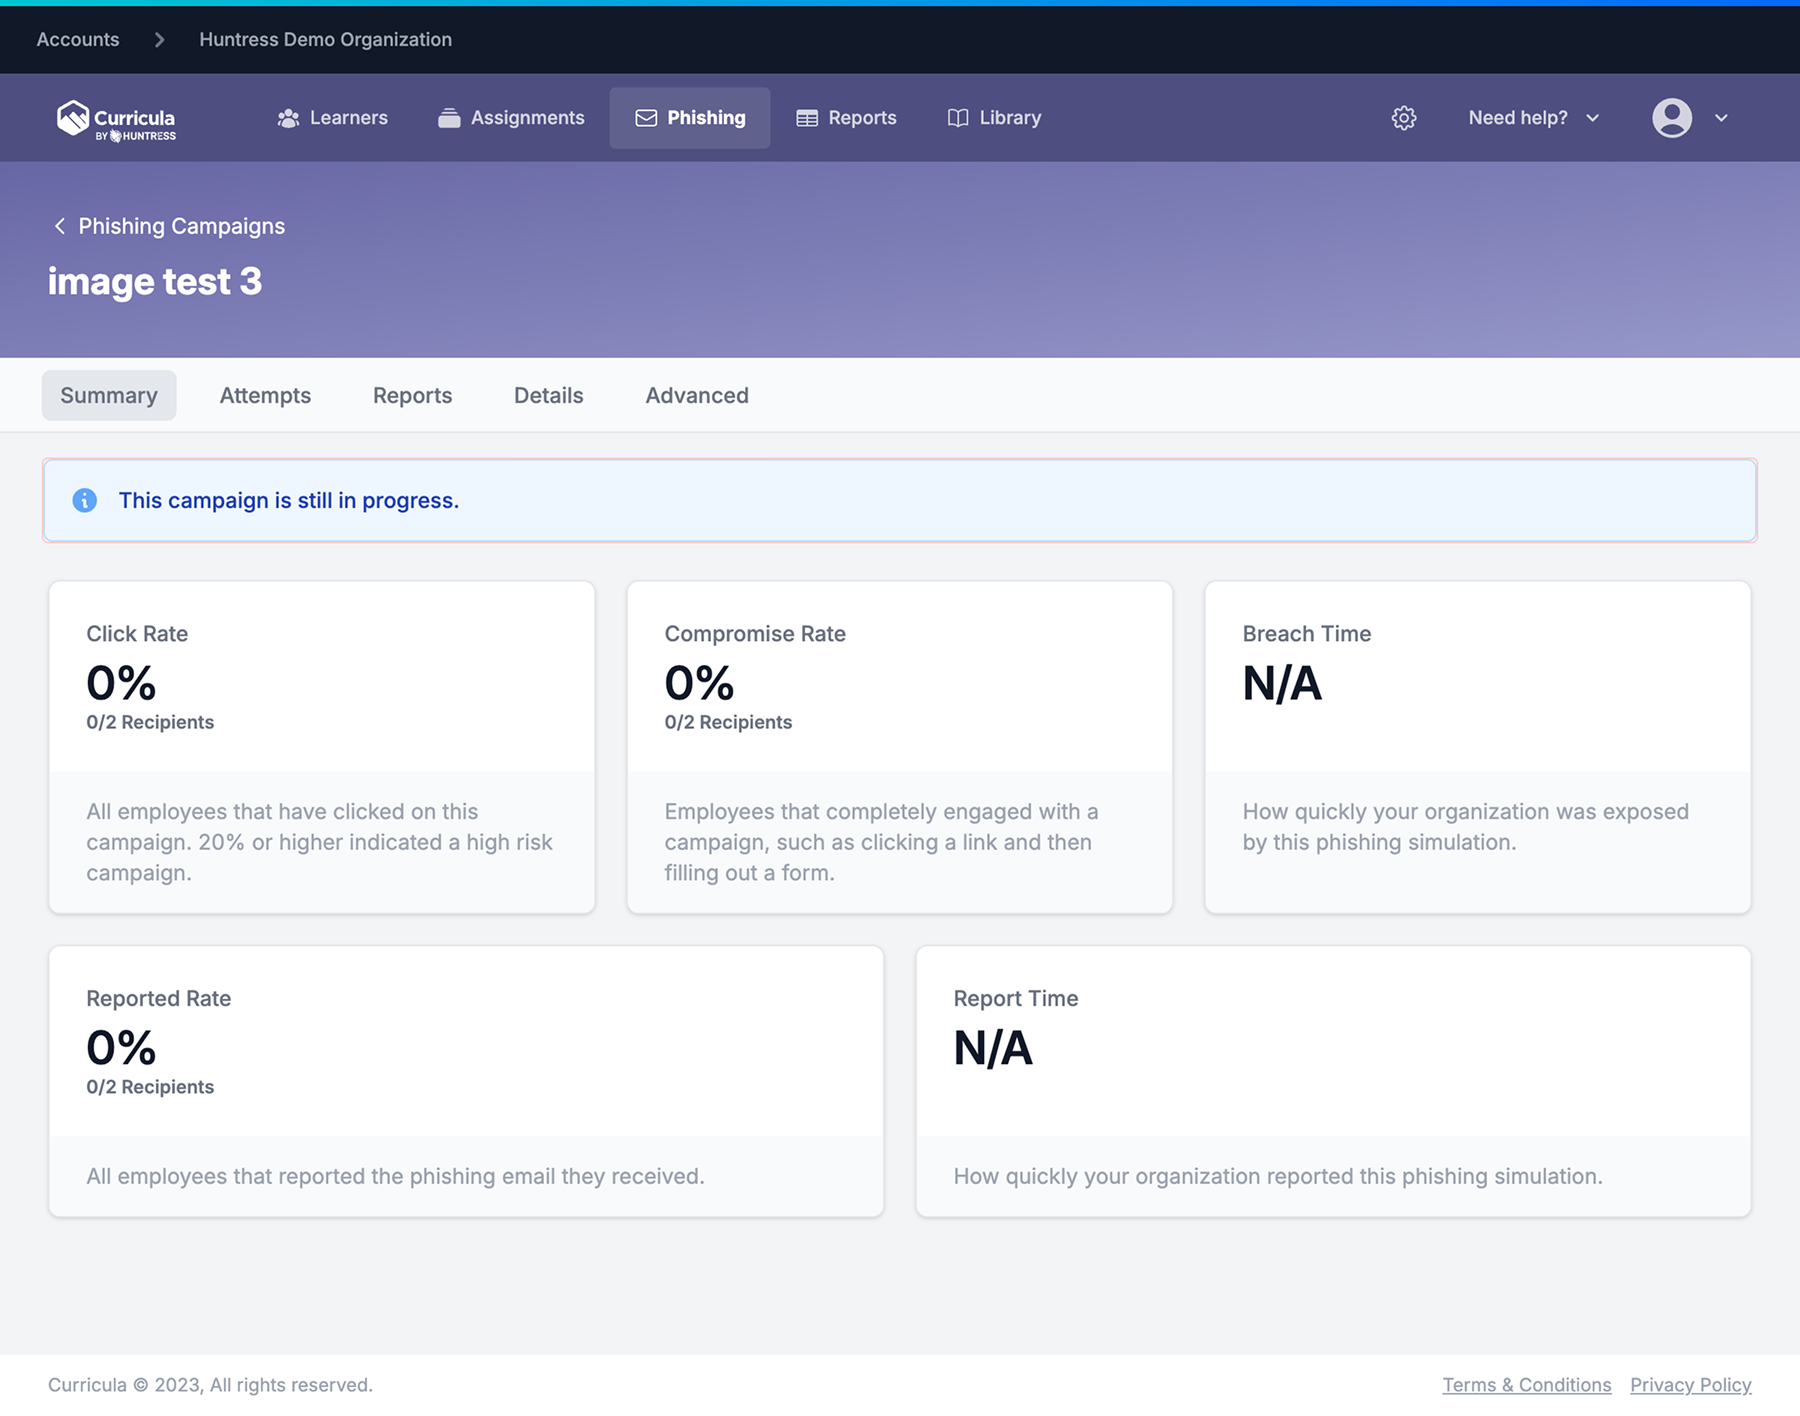
5-Tab Hunt, Total: ~10 minutes
TAB 1: Summary
See "9%" compromised
- • But 9% of what?
TAB 4: Details
Find total: 300
- • Mental math:
- • 9% × 300 = 27
TAB 2: Attempts
See all 300 learners
- • All show "in-progress"?
TAB 3: Reports
Download CSV
- • Wait for download...
Open in Excel
Sort by status
- • Filter "Compromised"
- • Count: 27 learners
Extract Names
Copy from Excel
- • Paste to doc/email
BEFORE EXPERIENCE
⏱ ~10 minutes
- • ❓ 5 tabs
- • ❓ Manual Excel
- • ❓ Confusion
- • ❓ Just numbers
After
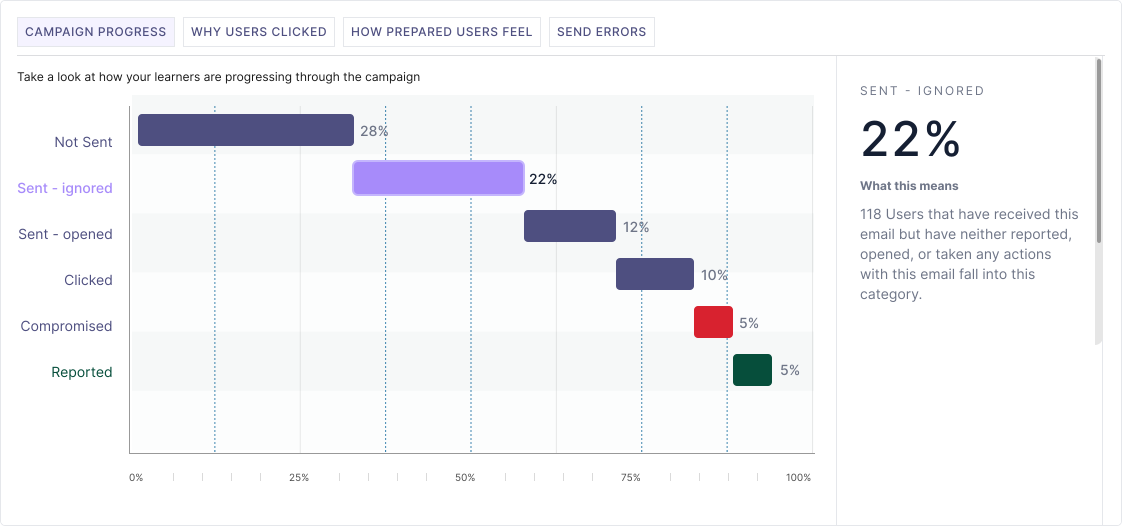
Direct Access with Campaign Intelligence, Total: 10-45 seconds
Open Summary Dashboard
Immediately see:
- • ✓ "Compromised: 27" + View link
- • ✓ "Learners: 300"
- • ✓ Visual progress chart
Click "View" or Scroll
See all 27 names
- • ✓ Instant list
- • ✓ WHY each clicked:
- • "I was in a hurry"
OPTIONAL: Details View
If need more info:
- • Timestamps
- • Departments
- • Engagement data
OPTIONAL: Export Report
One-click PDF
- • with all data + insights
ANSWER + INSIGHTS
Count: 27 (instant)
- • ✓ Names + WHY + preparedness
- • ✓ Learner feedback
- • "Can't accept not trying"
AFTER INTELLIGENCE
⏱ 10-45 seconds
- • 📊 1 dashboard
- • 👁 Instant view
- • 💡 Clear insights
- • 🗣 Learner voices
The power of numbers
I streamlined campaign management by reducing clicks, saving time, highlighting the most important metrics, and improving information architecture.
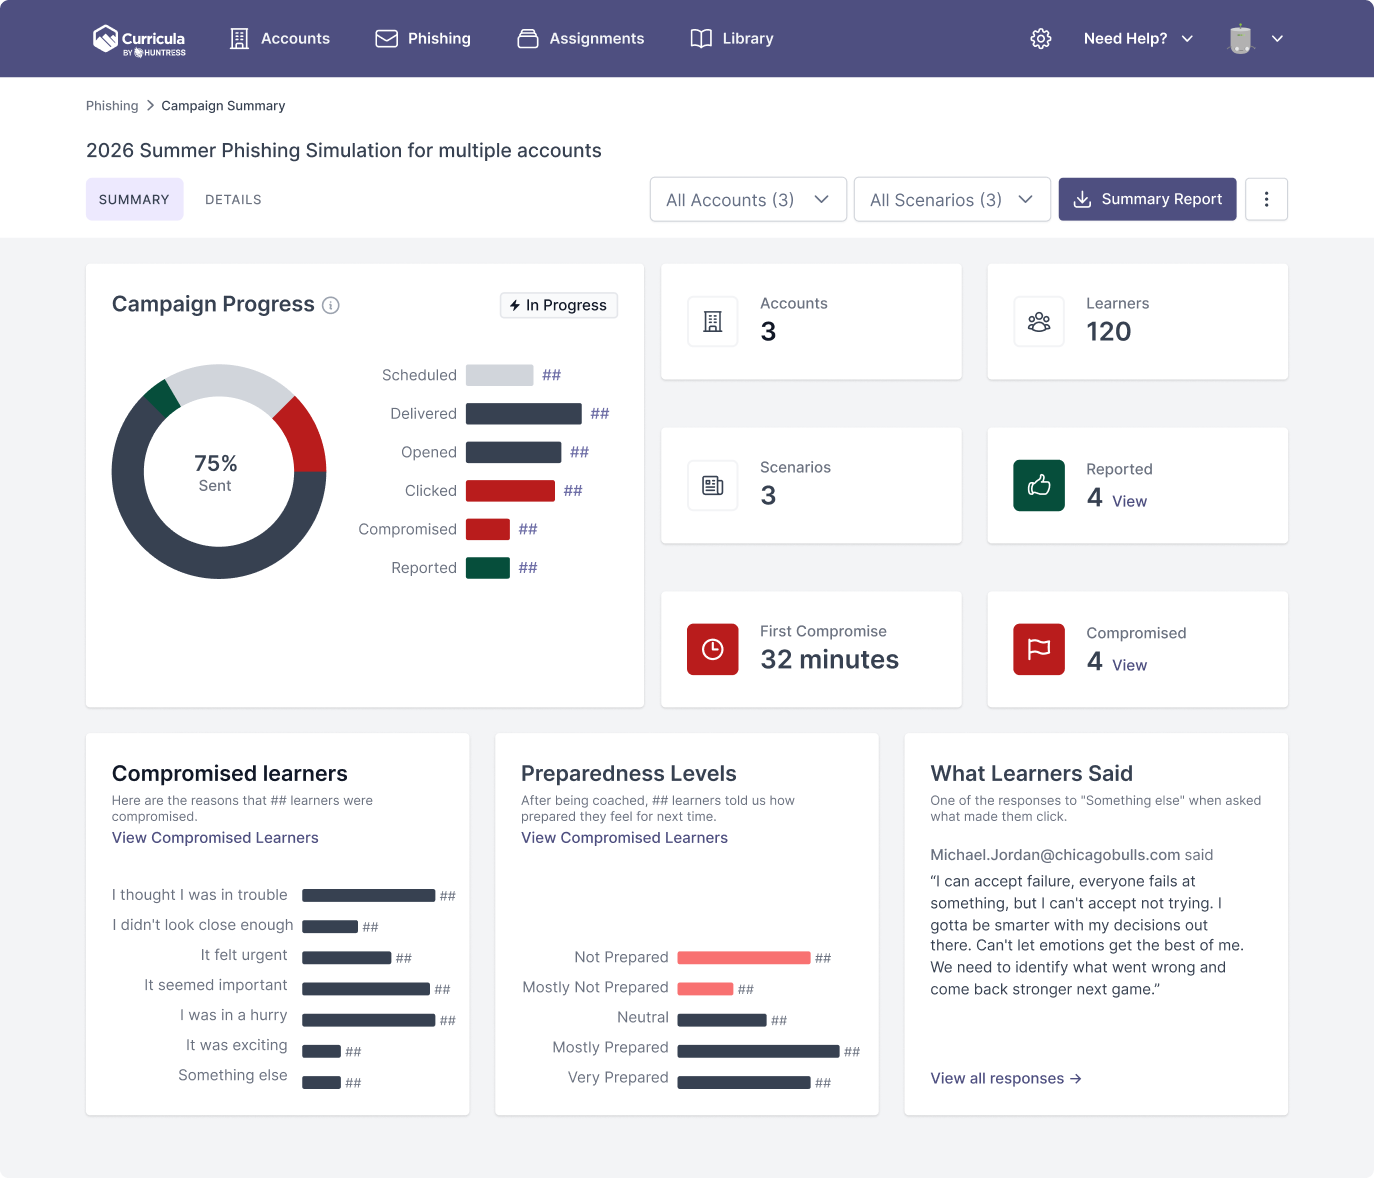
From campaign metrics to individual actions
See at-a-glance who clicked, who reported, and who was compromised, with advanced filtering to quickly identify departments or individuals that need attention.
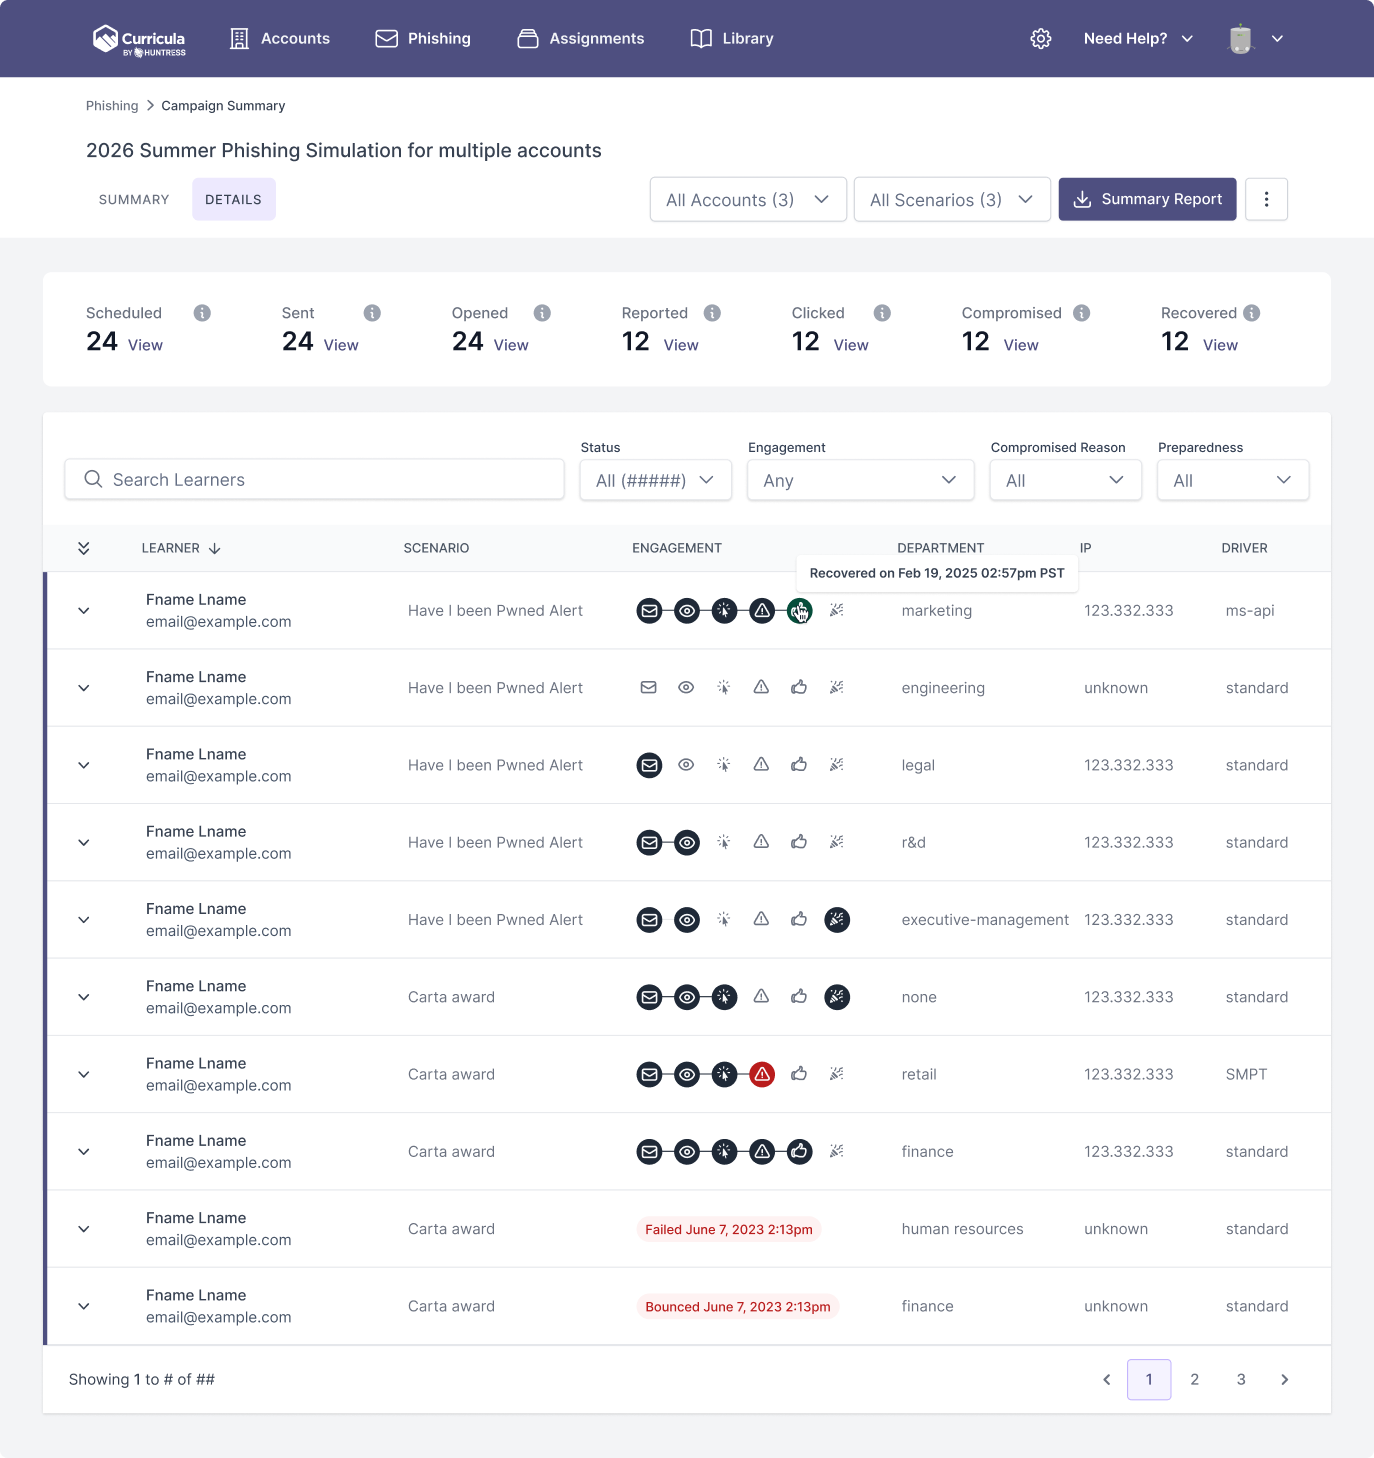
Welcome to Campaign Intelligence.
The first dashboard that captures why your people clicked, in their own words. Turn managing 50 companies from a full-time job into a morning check-in, while preparedness indicators spot unprepared users before they become statistics.
It's not just campaign management, it's understanding human risk at scale.